How to hide chart for web_log requests_by_vhost (too much data)

Using the go.d collector of netdata v1.35.0-84-nightly I configured several jobs on a node:

jobs:
  - name: nginx
    path: /var/log/nginx/access.log
    log_type: csv

  - name: default
    path: /var/log/nginx/access.default.log
    log_type: csv

  - name: internal
    path: /var/log/nginx/access.internal.log
    log_type: csv

The node will host a few hundred vhosts which makes the chart chunky and meaningless most of the time.

How does one generally disable the requests_by_vhost chart, and is it possible to disable it for specific named jobs?

I tried the following entries in /etc/netdata/netdata.conf and restarted netdata with systemctl but no effect:

[web_log.requests_by_vhost]
    enabled = no
[web_log_internal.requests_by_vhost]
    enabled = no

Without this graph I think my browser will be much faster rendering the page! Thanks

Hi there, love the Mr Bean avatar!

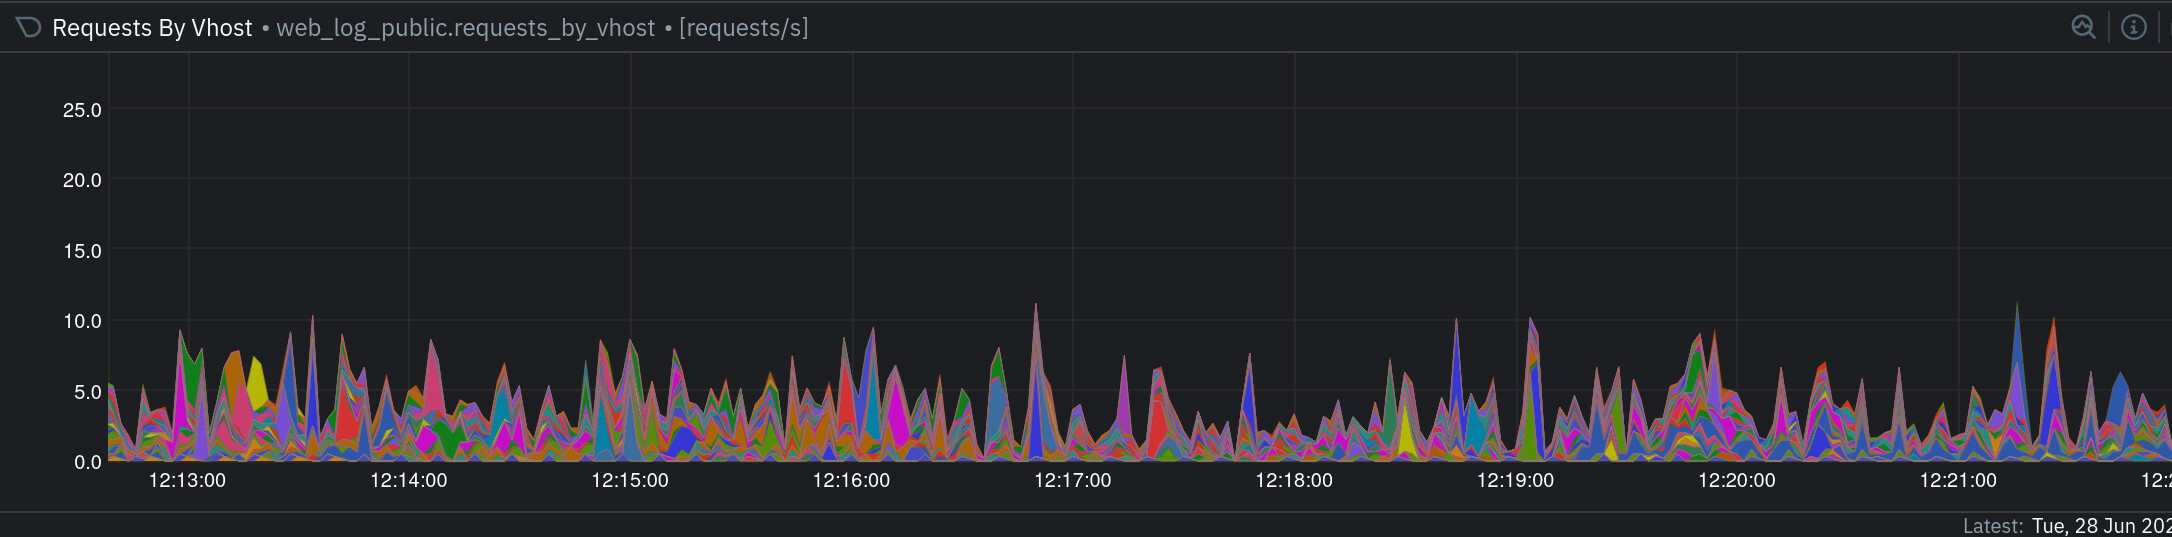
The screenshot shows a chart named web_log_public.xxx and I don’t see that in the list.
You could just grab yourhost:19999/netdata.conf and see the charts that are already there with # enabled = yes

If this isn’t it, let us know so we can investigate further

Out of curiosity, how many vhosts do you have on this machine?

Thanks for replying

The screenshot shows a chart named web_log_public.xxx and I don’t see that in the list

Oops I grabbed the chart from another server without explaining, just to demonstrate! The rest of the post should be accurate

You could just grab yourhost:19999/netdata.conf

When I check curl http://localhost:19999/netdata.conf I can see my failed attempt:

# section 'web_log.requests_by_vhost' is not used.
[web_log.requests_by_vhost]
	enabled = no

but no other mention of the web log collector

and see the charts that are already there with # enabled = yes

There’s not much mention of that actually, maybe I’ve gone wrong somewhere. The following blocks match:

[ml]
[health]
[plugin:proc:/proc/net/dev:eth0]

how many vhosts do you have on this machine?

The server has about 500 vhosts plus non-www redirects for a SaaS with “bring your own domain” feature. We do find other graphs useful like tracking 5xx responses

Apparently Remove per chart configuration. by vkalintiris · Pull Request #12728 · netdata/netdata · GitHub removed this capability. Investigating internally the reason.

We had performance issues with the specific configuration options. We’re getting someone to see about improving the collector.

1 Like