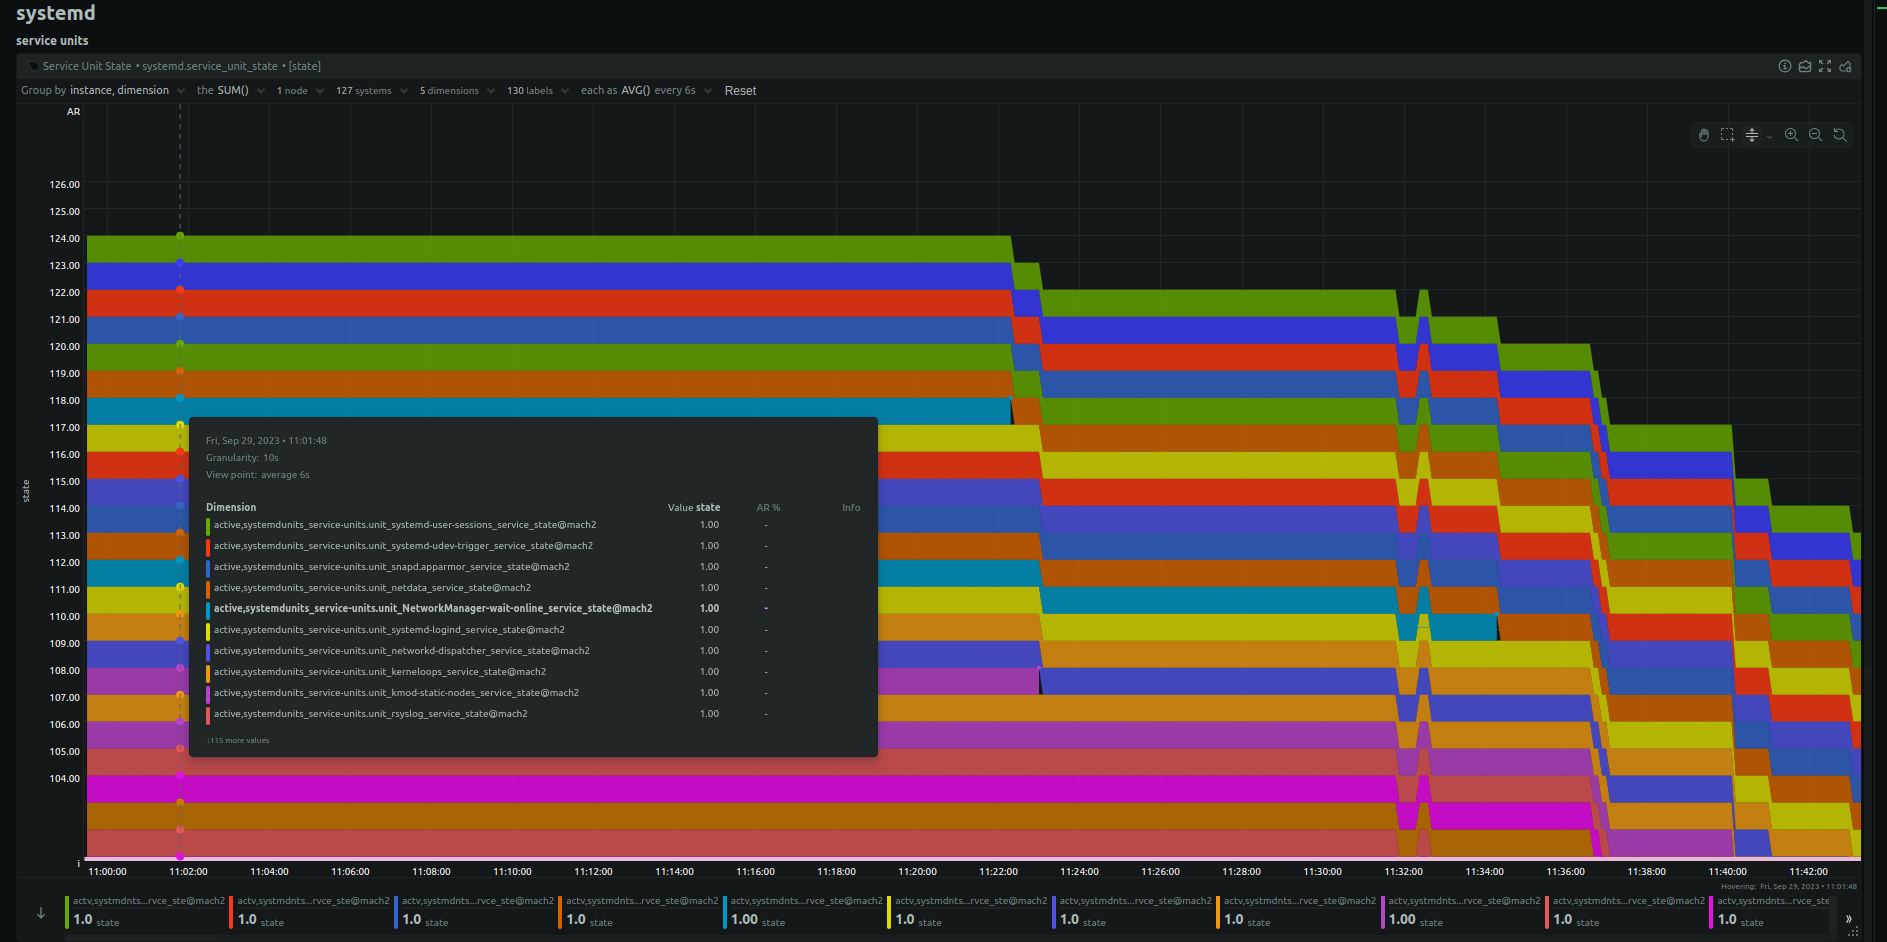
I’m trying to troubleshoot a server crash(s), so this post is more about how to get value from netdata rather than a problem with the software. The only clue so far is a drop-off in the systemd services chart, both active and inactive, for a couple of hours before the reboot. This has happened to a couple servers over the last year, including this one, and I am still stumped as to how to find the cause. I was hoping someone might help me get more info out of Netdata that might help.

On close inspection, the first service to go down was NetworkManager-wait-online_service followed by kmod-static-nodes_service about 30 sec later. I don’t know what to make of that, or why NetworkManager-wait-online was even active. Most other services crash over the next 2 hours, culminating in a reboot.
I’ve tried to find other metrics that showed unusual behaviour just before the decline started (before 11:30 AM). The BMC registered no system errors, so it may not be a hardware problem.
netdata v1.42.0-221-nightly, with sensors and nvidia-smi, ubuntu20.04.6
Epyc 7282, 128GB RAM, H12SSL MB
Can anyone give suggestions as to where to look next? Has anyone seen something similar before?