Problem / Question
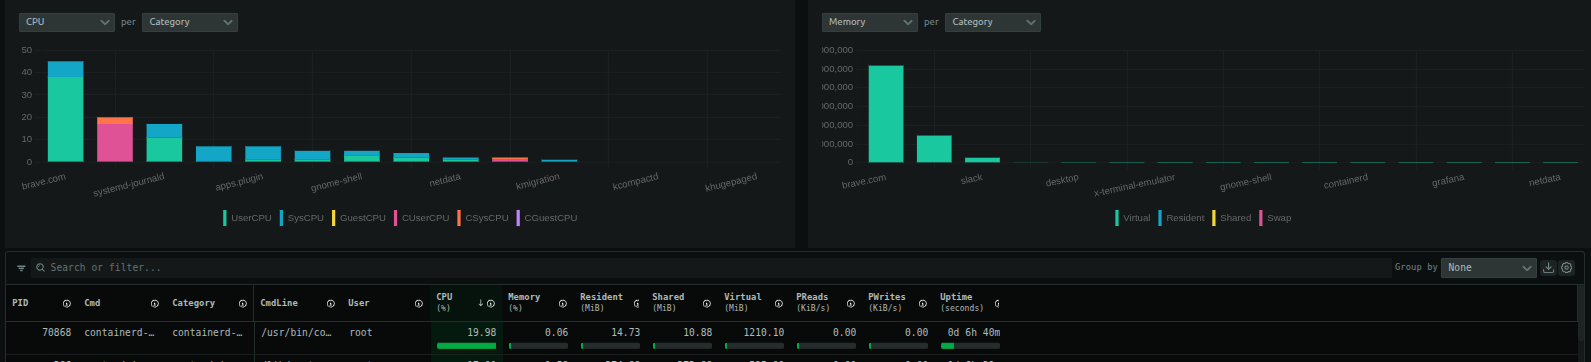
I’m trying to understand whether the data shown in the Top dashboard (especially per-process CPU usage) is exportable, and if so, whether it can be exported via Prometheus.
Additionally, the main purpose I’m looking for is to visualize process-level CPU usage over time (not just a point-in-time snapshot). I’d like to confirm whether this capability already exists in Netdata (either via built-in dashboards or exported metrics), or if the Top dashboard is primarily meant for real-time inspection only.
Specifically:
-
Is the data backing the Top dashboard exposed as time-series metrics?
-
Can this data be exported via the Prometheus exporter?
-
If process CPU usage over time is already supported, which dashboard(s) or metrics should be used?
Relevant docs followed / actions taken
-
Looked through Netdata dashboards and explored the Top / Processes views
-
Reviewed exporter-related documentation to understand Prometheus support
What I expected to happen
I expected that the data powering the Top dashboard (process CPU usage) would either:
-
Be available as historical time-series metrics, and
-
Be exportable via Prometheus so it can be visualized externally (e.g., Grafana) over longer time windows.
If the Top dashboard is intentionally real-time only, I’d like to understand what the recommended way is to track process CPU usage trends over time in Netdata.