Problem/Question
I am sure I have something configured incorrectly, but not sure. I am not getting as much data retained as I would like. I have
Environment
host is running 1.29.3, and I have 10 others streaming to this host all running older versions.
[global]
memory mode = dbengine
dbengine mutihost disk space = 108765
page cache size = 64
# history = 604800
[API]
commented out default memory and history
What I expected to happen
I expected it to keep data till the disk space filled to 100G, but I only get 2.5 hours in the web interface of data.. I would like to be able to view more in the interface. Can someone point to where I am configuring it incorrectly.
hmm - i think it might also depend on what is in /etc/netdata/stream.conf on the parent node. Can you share that too?
here is how i have it set up for a development parent node i am using.
netdata.conf on parent:
[global]
        ...
        dbengine multihost disk space = 1024
        ...
where ... means i just left everything else alone.
stream.conf on parent:
[111-222-333-444-555]
    enabled = yes
    # default history = 604800
    default memory mode = dbengine
    health enabled by default = yes
    allow from = *
    multiple connections = allow
stream.conf on child:
[stream]
    enabled = yes
    destination = my.ip.address:19999
    api key = 111-222-333-444-555
So i’m not sure if anything obvious jumps out from that.
Alternatively maybe it could be something to do with children being older versions maybe but that should like could almost be a bug then that we would need to look into.
netdata.conf on parent:
[global]
run as user = netdata
memory mode = dbengine
dbengine mutihost disk space = 108765
page cache size = 64
# the default database size - 1 hour
# history = 604800

# some defaults to run netdata with least priority
process scheduling policy = idle
OOM score = 1000

stock config directory = /etc/netdata/conf.d
[web]
web files owner = root
web files group = netdata
# by default do not expose the netdata port
bind to = 0.0.0.0
[health]
stock health configuration directory = /etc/netdata/conf.d/health.d
conf.d/stream.conf :
[api]
enabled = yes
allow from = *
default memory mode = dbengine
health enabled by default = yes
default postpone alarms on connect seconds = 60
stream on child :
[stream]
enabled = yes
destination = *********
api key = [api]
timeout seconds = 60
default port = 19999
buffer size bytes = 1048576
reconnect delay seconds = 5
initial clock resync iterations = 60
With these setting I get about 2.5 hours of data and it rolls off…
Working properly and only maintaining a couple of hours of data with so much disk space given is strange. I’d expect you to run out of memory before the metrics get rolled off.
I doubt it’s this, but if you look at the bottom right of the UI, how many metrics do you have in total from all 11 nodes (parent + children)?
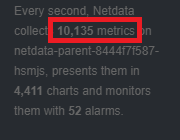
I don’t expect you have something so exceptionally large to cause this, but let’s see. A “normal” number is ~2k-3k metrics per node.
This calculator is not perfect, but it gives a general idea of the storage and memory required for specific metrics.
unfortunately mine does not five me a nice summation of the total metrics, but adding them up it was a total of 29200 metrics (and it was 2 - 3K a node… I think one was just over 4). Memory usage is sitting at 800M and disk is only using 384M.
It should have the summation. Can you please share with us the version of the Netdata Agent that you are using? We should fix this if it’s a bug.
Thanks for your patience in counting them manually 
Hi @Robert_Morrow
Please edit your netdata.conf file and fix the following
dbengine mutihost disk space = 108765
Notice, that it says “mutihost” instead of multihost
I feel stupid now with that typo. Thank you @Stelios_Fragkakis for your attention to detail in catching my simple mistake. Everything is working as planned now. 
@Robert_Morrow lol - was about 3 or 4 of us who also missed it
@Stelios_Fragkakis gets the attention to detail award!
@Robert_Morrow, can you please tell us the version of the netdata agent that you use and send us a screenshot of the dashboard? I want to root-cause the reason behind you not having the summary of all the metrics that you are gathering.
@Stelios_Fragkakis  , except that he always pays attention to detail.
