Newbie with Netdata Cloud Business Trial so forgive me if the answer should be obvious. And apologies if this has been answered but I’ve not been able to find something that seems to address this problem.
Installed the Windows Netdata Agent (v2.2.5) on 5 Windows servers. 3 of these are reporting all system metrics without any configuration. 2 of them appear to be only returning Synthetic metrics (will attach screenshots when I get them back online). This is despite several uninstall-reboot sequences on those 2 servers.
The 2 problem servers are nearly identical (HP Proliant DL20 G9/G10) to one of the other servers that is reporting all system metrics okay. These 3 servers are physical servers and the other 2 that are reporting all system metrics okay are VMware VM’s running Windows Server.
I’ve tried installing the agent via the GUI as well as command-line. Both with and without specifying room id’s.
Any ideas why this might happen?
Or how/where I go to investigate why?
Does the Netdata Agent write logs on the node being monitored that might provide some clues?
Can I add the Windows integration metrics to the dashboard for these nodes manually or do I have to find another way to get the system metrics for these servers?
I think I’ve had a pretty good look through the docs but an answer is still not clear to me. Happy to keep reading and digging if someone can point me in the right direction.
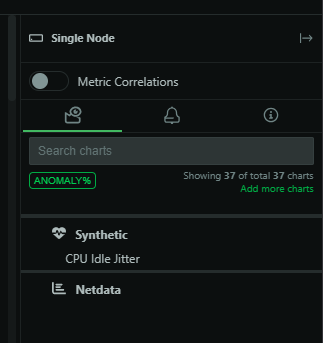
Installed the agent again on one of the problem servers. This is what I see on the all nodes summary dashboard for that server (https://app.netdata.cloud/spaces/[my-space]/rooms/all-nodes):
I’ve also successfully added SNMP collectors/metrics to the problem server/node previously that work okay. But how do I add the System collectors/metrics?
Hello ilyam8. If you mean restarting the netdata service then yes. Also restarted the server several times with no change. Have also uninstalled and re-installed the netdata agent several times. And deleted the node in Netdata during a couple of those uninstall-reinstall attempts.
I’ve also tried disabling our endpoint security real-time scanning software during the install process. Although I’ve not had to do that on other Windows Servers where netdata is working as expected.
None of the above seems to make any difference although it’s easily possible that I’m missing something obvious.
Does netdata write any logs that might provide a clue to something not working/failing?
Perhaps the problem servers are missing the Windows OS tools that netdata uses to get the metric data. Or these tools are failing for some reason. Can someone tell me what these tools are so I can maybe check separately if they’re working?