Problem/Question
ML charts are appearing for the Child Node on the Parent Node, even though the charts are disabled on the child node.
I’ve disabled ML charts on the child node in the netdata.conf
[ml]
	enabled = no
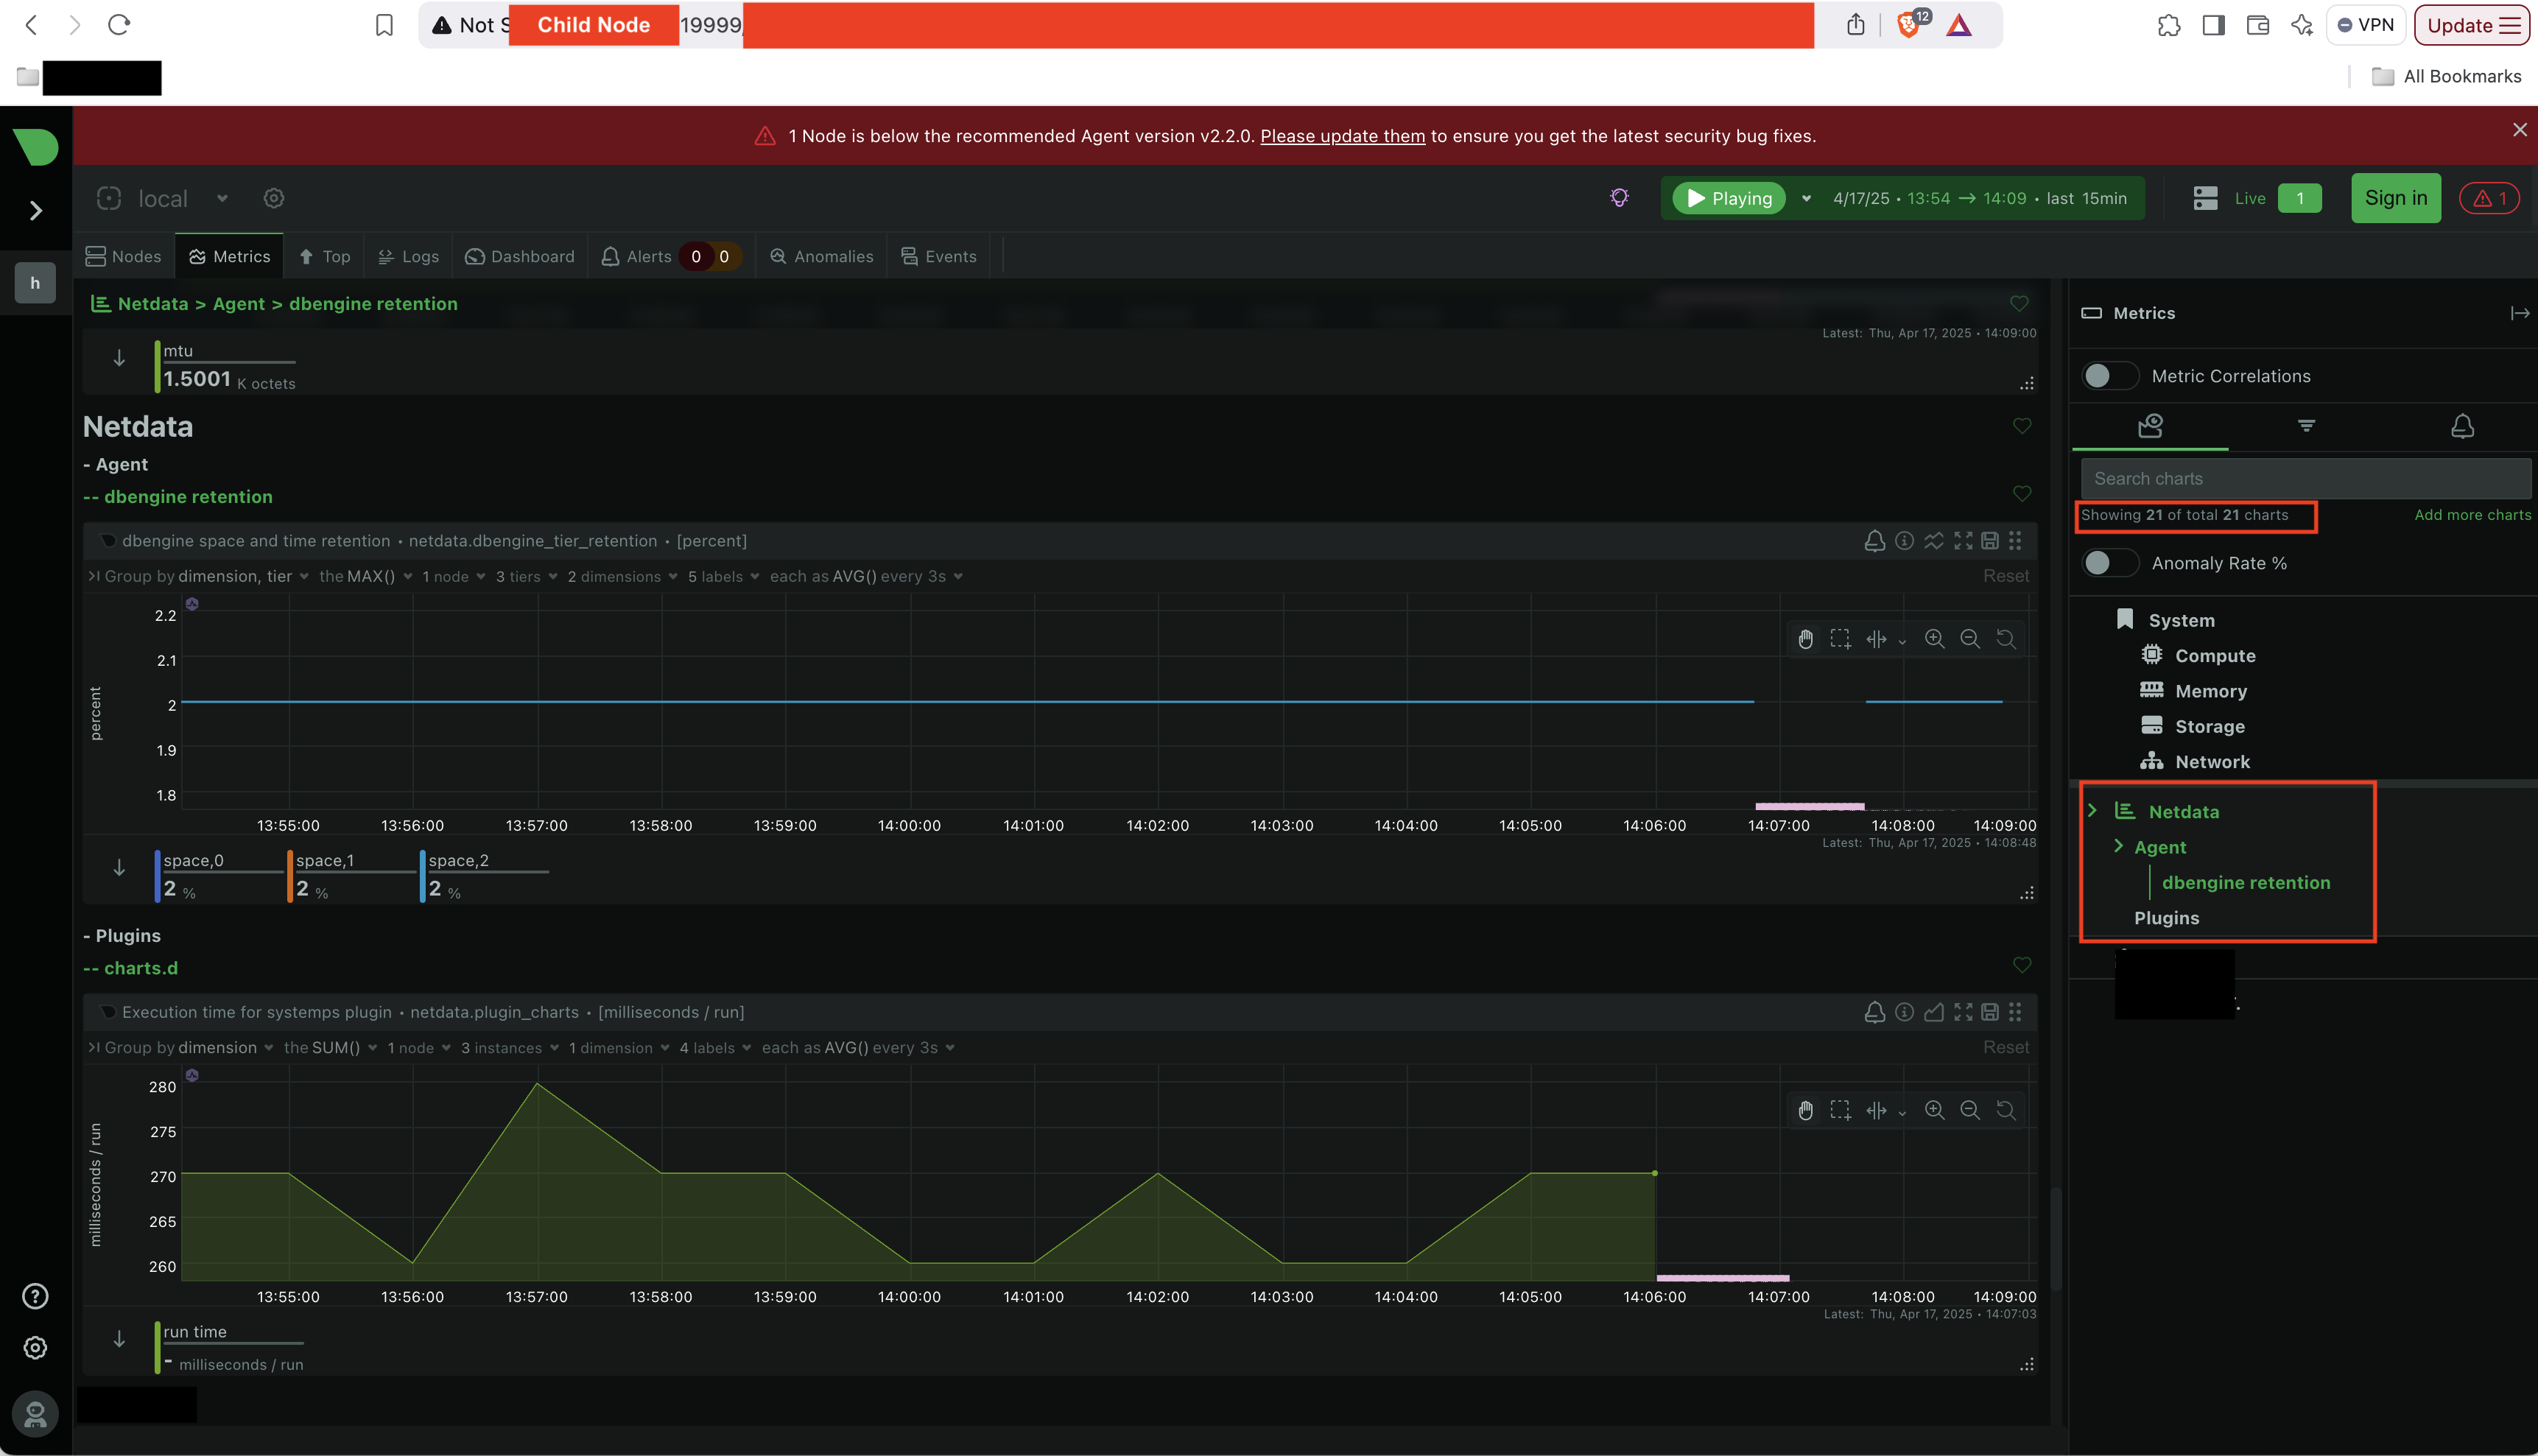
The child node iteself doesn’t contain the ML charts: It has total of 21 charts only
But it’s Parent Node counterpart has ML charts, and the total is 29 charts:

I stopped streaming from the Child to Parent, but still the ML charts data were continuing to come in, whereas the others charts had no data.
Why do I see such observation?