I’m seeing invalid results in the new dial gauges (notices the style was updated to include tick marks).
You can see the machine has 64G but the dial shows 100% at 29G, also the CPU is pegged, but showing 11%
I did not include in the screen snip, but it was playing when this was grabbed.
Hello @tomtobin,
Thanks for your report. The summary chart for system.ram is defined as a “percentage-of-instance” and the unit needs to be “%”. I am attaching a sample snapshot from our environment.
Can you please try and clear your cache and reset the page?
Also, can you provide more details on the CPU utilisation? On our system, the Average CPU per node in case of a single node / instance reports the absolute value of CPU Utilisation - please see attached.
Thank you - yes, the RAM gauge is showing in GB, not % - I will try to RTDM to figure out how to change that, but it did change on its own somehow. On CPU, still stumped, here’s another screen shot - it looks like it’s reporting % of total available - e.g. 99% / 8cpus, but even then it’s low, should be 12.x % not 11
Here’s a snapshot from my setup and it does show the right value.
The system.cpu charts do not consider the cpu cores and you can find these in the CPU section separately. These charts show the average CPU utilisation across all the nodes in your infrastructure. In your case, based on where you are hovering the Average CPU Utilisation should have been 99.7%. Can you check if the summary chart is still loading? Also, do the values change when you hover on the chart?
Since the Average User RAM per node is still showing up in GiB in your case, can you try reloading the page by clearing cache - https://www.howtogeek.com/672607/how-to-hard-refresh-your-web-browser-to-bypass-your-cache/#:~:text=Because%20there%20are%20multiple%20ways%20to%20do%20the,no%20shortcut%20to%20force%20a%20cache%20refresh.%20
PS: These summary chart show instantaneous values and by default show the utilisation for the latest timestamp. But when you hover over your chart like you have done currently, they show the value at that instant.
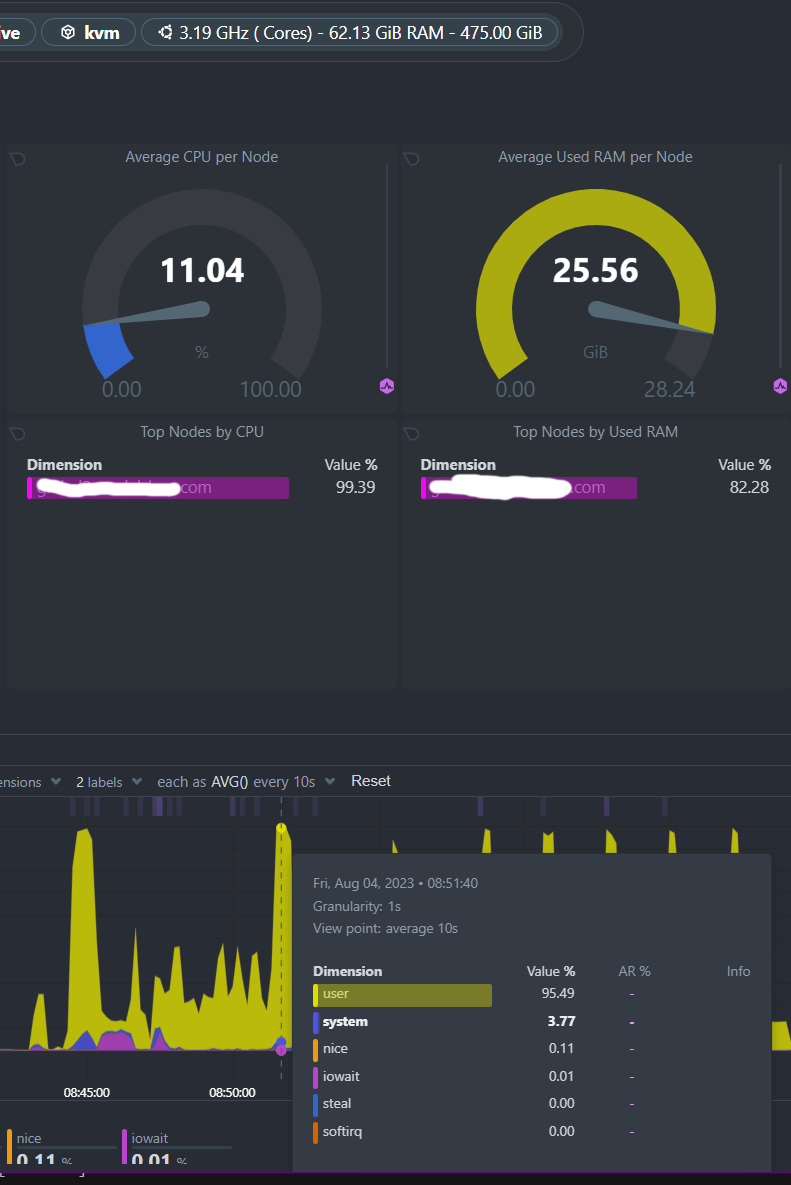
Hi again - I am still struggling to use these summary charts effectively. The ‘per node’ charts never show the actual cpu or ram, it’s almost like it’s averaging across multiple nodes, but this is the dashboard for just one node - is that where I’m confused - is this now a cross node chart even though it’s on the dashboard for this one node? See that at the time selected, CPU was 95.49%, but the Average CPU per Node is 11.04 - but only one node is shown below. It’s like it has 9 nodes it’s averaging across, but I can’t see a list of nodes.
Note - this is on just one of my nodes, other nodes look fine.
Hi - bumping this, there seems to be 9 ‘nodes’ for this one node, so all the gauges are 1/9 what they should be, can someone help me figure out why additional nodes are impacting this single instance server?